Recommendations For Using Python/R in Power BI
These are my personal recommendations when using Python / R in Power Query and Visual


Overview
Using Python and R in Power BI, when used correctly, can allow quick experimentation, data/calculation validation, statistical analysis/inferencing of the data. However, before you use Python/R in Power BI keep the performance and data privacy issues in mind. I personally use Python in my report development, model development process but use it as a tool for experimentation rather than replacement to native Power BI tools. Below are my recommendations / tips:
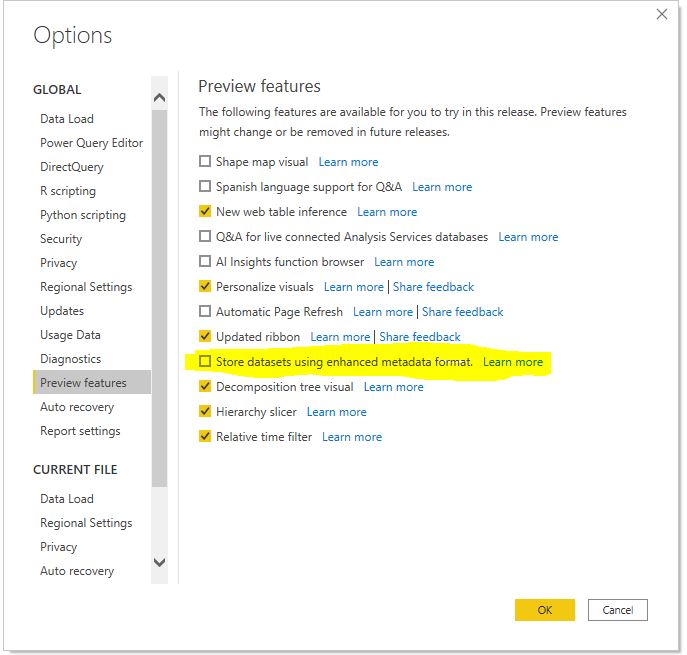
- Uncheck “Enhanced meta-data” if you are using Python. Power BI released it as a preview feature in March 2020. Unfortunately, I learned it the hard way. If you use Python in Power Query with this option selected and save the file, it will currupt your file and you cannot recover it back (well, not entirely). Enhanced metadata allows read/write XMLA (Premium feature). This is a serious bug that MS needs to fix. If you need to use this option, use R.
- Keep the data privacy implications in mind. Data Privacy must be set to "Public" . While that does not mean the report/dashboard/data are made public, do not use Python /R if you are working with sensitive data. When the data privacy is set to "Public", Microsoft stores it in less restrictive storage but the data is safe.
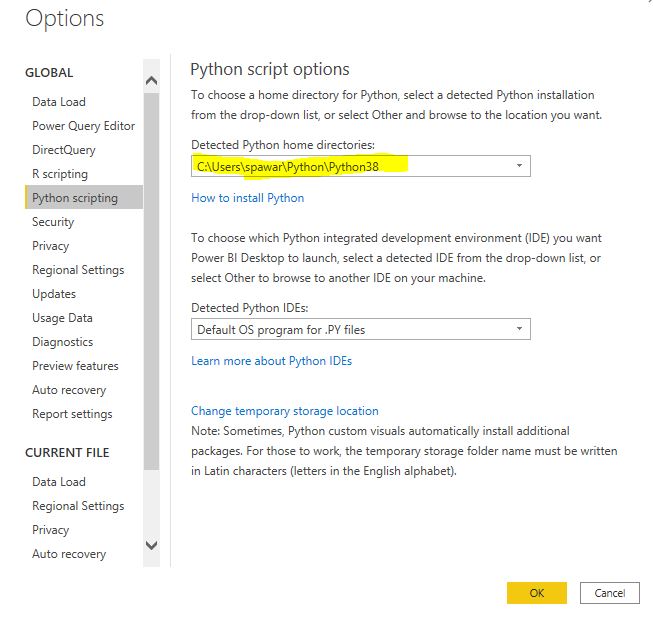
- Always create and use virtual environment ,e.g. use virtualenv/pipenv, conda. Conda may not always work if multiple Python copies are installed and is a known issue. More on Python virtual enviroment here. Use the directory of the virtual environment as Python home directory.
- Only install the packages you need. Power BI needs pandas and matplotlib installed at minimum. I personally only use Pandas, Numpy, Statsmodels, Scipy, Scikit-learn, Matplotlib, Seaborn in my Power BI virtual environment. If you find yourself needing more packages, you should consider using the IDE and deploying Python/R outside of Power BI.
-
Only import the packages you need, e.g.
from scipy.stats import lognorminstead offrom scipy import *to the reduce execution time
- By default, Power BI loads pandas, matplotlib and os, no need to re-import it (
import pandas as pd). If you do need to alias the package, create a variable,pd=pandasand then you can usepd.read_csv(..)
- Change date column to text before running Python and change it back to Date format after running the script. If you keep it as Date, all Date values will be returned as "Microsoft.OldDb.Date". You can also change the column type to Date/Time and parse it back but it's esier to convert text.
- Duplicate the original query and apply Python /R on duplicated query, instead of the original.
- Apply Python / R as the last step or when the rows have been filtered, unnecessary columns have been removed to reduce the *.csv file Power BI creates. The temporary csv file must be <250 MB, so it's best to reduce the data to keep the file size down.
- Use only one Python / R script in a query, if you must use Python / R.
-
Always run Query Diagnostics to make sure Python/R script isn’t the bottleneck, query execution time is << 5min. Query will time out if the execution time is >30 minutes. Run the script in your IDE to time the execution. If you are using Python, vectorize the data to improve efficiency, avoid for loops, use
apply(), avoid intermediate dataframes.
- Power Query is powerful and preferred, so don't use Python / R as a replacement. Use it for quick experimentation, data validation, spot/sanity checking, calculation validation, statistical analysis only. I use it often in my workflow for finding patterns, anamolies, outliers, correlation etc. using Power BI + Jupyter (blog to come. ). I have intentionally left out Machine Learning here. I do not think an ML model should be deployed as a Python / R script because of the limitations and it's a bad deployment practice in general. ML models need to be revised, monitored for performance, data drift etc and Power BI does not allow that. Do not deploy ML models in Power Query
- Use Power Query Parameter in Python /R if you need to reuse a script or need a quick way to change arguments,params. You can pass
&Text.From([param])or&Number.From([param])in any Python / R script to make it more dynamic.
- Apply correct summarization for visuals (No summarization, sum, average etc.), always add an index/unique key to make sure rows are not removed.
-
Create Python/R visuals after you have finalized column/measure names. Renaming column/measure will throw an error
-
Use native Power BI visuals for production reports and Python/R visuals for getting more insights and for experimentation. Power/R visuals are very slow to refresh and do not allow cross-filtering, highlighting.
-
If you do use Python/R visual in production report, run the Performance Analyzer to check execution & refresh time. If it's too slow, consider using native visuals or build one in charticulator. I rarely use custom visuals to avoid dependency and data security reasons.
David Eldersveld provides an excellent overview in his video and blog
Reference:
- https://docs.microsoft.com/en-us/power-bi/connect-data/desktop-python-scripts
- https://docs.microsoft.com/en-us/power-bi/connect-data/desktop-python-in-query-editor
- https://docs.microsoft.com/en-us/power-bi/connect-data/desktop-r-scripts
- https://dataveld.com/2018/11/10/5-performance-tips-for-r-and-python-scripts-in-power-bi/